Steering Generative Models for Accessibility: EasyRead Image Generation using OpenMoji
Steering Generative Models for Accessibility: EasyRead Image Generation using OpenMoji
This is a guest post by Nicolas Dickenmann and co-authors from ETH Zurich / UNICEF.
Artificial intelligence is rapidly transforming how visual content is created. Generative models can now produce stunning, intricate images in a matter of seconds. But while these highly detailed outputs are visually impressive, more detail isn’t always better.
EasyRead is a format designed to make information universally understandable, pairing simple text with clear, unambiguous pictograms. It is an essential communication tool for people with intellectual disabilities, learning difficulties, or limited language proficiency. Unfortunately, modern image generation systems are not designed with cognitive accessibility in mind. They default to producing visually complex, abstract, or cluttered outputs that directly contradict EasyRead guidelines.
This gap is the motivation behind our recent paper, Steering Generative Models for Accessibility: EasyRead Image Generation, which was recently accepted at the upcoming CHI26 conference. In it, we tackle a critical question:
Can we teach state-of-the-art generative models to prioritize cognitive accessibility and visual simplicity over complex aesthetics?
Method: A Custom Pipeline for Cognitive Accessibility
To solve this, we couldn’t just rely on standard prompt engineering, as base models still tend to inject unwanted details. Instead, we needed to systematically steer the model’s visual representations by building a dedicated EasyRead pipeline.
Our pipeline consists of a few key steps:
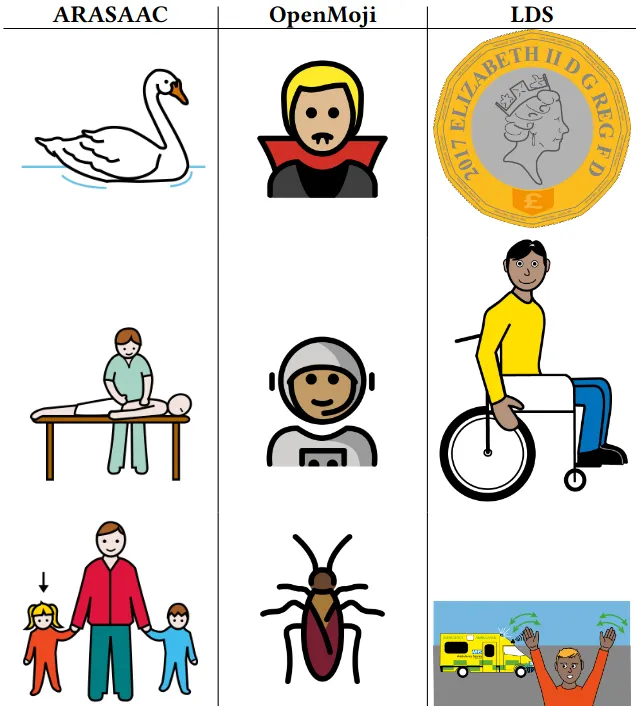
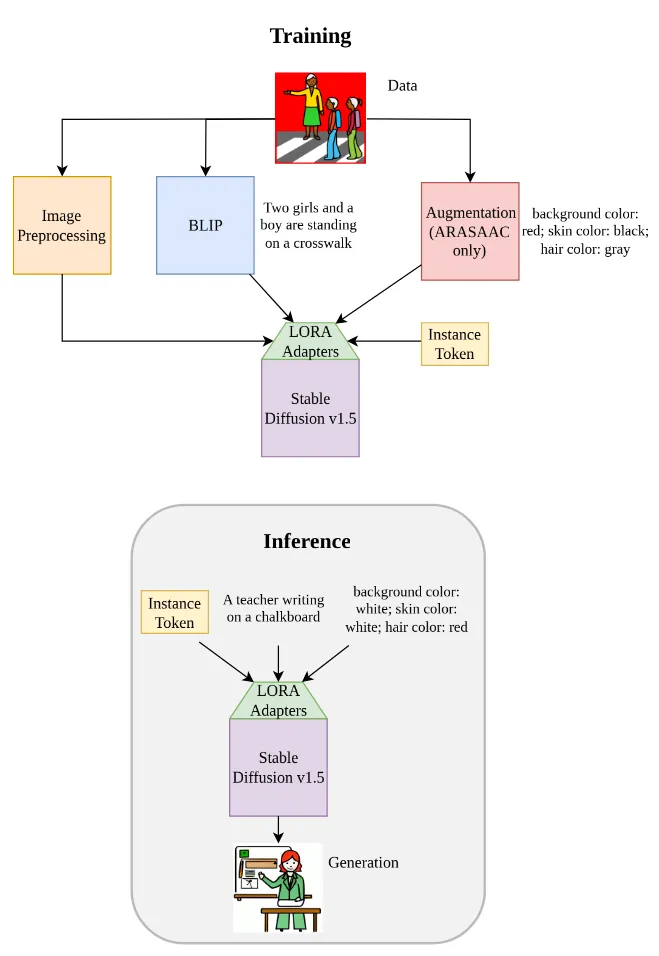
- Curating and Enhancing the Data: This is where the incredible foundation built at HfG Schwäbisch Gmünd by the OpenMoji project became essential to our research. To teach our model what a consistent, clear pictogram looks like, we used OpenMoji’s extensive, open-source library as a core pillar of our training data, combining it with complementary datasets from ARASAAC and LDS. Because standard emoji labels are naturally brief, but a bit too sparse for training a complex diffusion model, we used the BLIP image captioning model to generate rich, natural-language descriptions.
- Strategic Augmentation: To enable targeted customization at inference, we leveraged the ARASAAC API to systematically augment the training images with varying background colors, skin tones, and hair colors.
- Parameter-Efficient Fine-Tuning: We fine-tuned Stable Diffusion v1.5 using Low-Rank Adaptation (LoRA) on the attention layers. By keeping the core model weights frozen and introducing a unique instance token (sks), we successfully taught the model the strict “EasyRead” style without losing its broad semantic knowledge.
Measuring Success: Introducing the EasyRead Score (ERS)
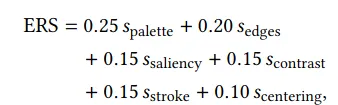
A major bottleneck in accessibility research is evaluation. To bridge this gap, we introduced the EasyRead Score (ERS), the first quantifiable metric that formalizes accessibility-oriented design principles. The ERS is an aggregate of six distinct sub-metrics that evaluate:
- Palette Complexity (Low visual clutter)
- Edge Density (Simple geometry)
- Saliency Concentration (Clear visual focus)
- Foreground-Background Contrast (Strong separation)
- Centering Error (Stable layout)
- Relative Stroke Thickness (Consistent outlines)
Results: Measurable Clarity and Precision

We evaluated our fine-tuned model quantitatively against the baseline Stable Diffusion v1.5 across 275 generated images. The data showed that our lightweight adaptation substantially improved both style and semantic accuracy. Additionally, we qualitatively evaluated our model against closed-source systems, and noticed substantial advantages on stylistic consistency and instruction following.
Looking ahead
Generative AI shouldn’t just be a tool for creating complex digital art; it needs to be a practical utility for making the world more accessible. Moving forward we see exciting real-world applications, reducing cost of accessible communication while increasing availability. By designing generative systems with accessibility in mind, we can ensure the AI revolution leaves no one behind. Check out our full paper here, and explore our open-source code and checkpoints on GitHub!
Nicolas Dickenmann is affiliated with a research team at ETH Zurich / UNICEF. All rights to the images remain with their respective copyright holders.